When people generally react to QRM: “Isn’t that planning to max. 80% capacity?”.
Indeed, that’s the first number we call out when it comes to creating flow in the company. However, behind this percentage is a whole explanation to why this is the case. We will elaborate further in this blog.
To start with the basics, QRM consists of the 4 core concepts:
- Highlighting the power of time
- Creating the right organizational structure
- Exploiting system dynamics for better decisions
- Building a company-wide strategy
Planning to 80% of the maximum capacity is a subject from the concept ‘System Dynamics’. With QRM it’s all about time and striving to minimize waiting time in the entire system. In order to achieve this, it’s important to realize the largest possible flow. By flow we mean that the orders flow quickly through the organization, with hardly any delay.
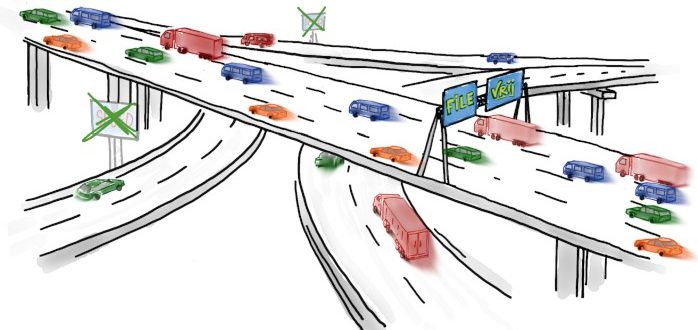
Compare it to a 100 km drive on the highway from A to B. Thinking in costs (economical) is still prevalent in many organizations. “We need to plan to maximum capacity (100%), as keeping the pressure on the system and our workers is prolific. The people will work harder and that’s efficient. Is that really true though?
If you drive from A to B on Monday morning, in the middle of the morning rush hour, that 100km can easily take up to 2 hours. If you drive this distance at ten o’clock in the evening, when the roads are pretty much empty, you can easily cover that distance in less than an hour. Focusing on the shortest possible travel time, the better choice is to implement in the evening. Although it might be the case that you do not have to be there at that specific time, so you will have to make choices. All this has to do with System Dynamics. This is exactly what companies encounter in their daily practice. Which choices do companies make based on all wishes, available data and options?
During the rush hour, the occupation of the highway we need to cross is too high. The vehicles on the highway all drive at a slightly different speed, so that all cars need to react to each other. As a result, every vehicle must anticipate the actions of other vehicles, resulting in phantom traffic jams; suddenly reducing speed from 100 km/h back to 0 km/h and then increasing speed again after a few seconds. The response between different vehicles also happens in companies between the orders.
The companies best applied to QRM are characterized by a wide variety of products with low volumes or customization (ETO and MTO). Orders also move at different speeds. In the QRM philosophy based on system dynamics, this is due to 5 factors that strongly influence each other.
These factors are:
- Capacity utilization (man and machine)
- Variation in processing time
- Variation in arrival time
- Changeover times
- Batch size
Reducing the occupancy (capacity) to 80% is one factor (button) that you turn. However, this immediately leads to an interaction with the other factors. All these factors must be coordinated.
Back to the highway example. If we concentrate on the output, then the output during the morning rush hour is most probably higher than at ten o’clock in the evening. This is caused by the high probability that the occupancy of the road isn’t 80% at ten o’clock in the evening, but much lower. Maybe only at 30%.
When thinking in flow with QRM, we search for the optimum point where the lead time is as short as possible and the output as high as possible. To reach this point, we coordinate the various factors until we have created the highest possible flow.
The factors, variable processing time and arrival time, mainly have to do with limiting the variables. You are now probably thinking this; “But a high variability is precisely what makes QRM well applicable?” This is correct, but we are trying to categorize the variation. QRM calls this categorization the Focus Target Market Segment (FTMS).
VISIT THE WEBSITE
READ MORE & SIGN UP
On the public roads we have all types of vehicles: bicycles, trucks, sports cars and family cars. All on the same lanes. They all affect each other. If we take a three-lane highway as an example, this can be categorized as follow: the right-hand lane is intended for freight traffic (approx. 80 km/h), the left lane is for the faster driving vehicles (approx. 120 km/h) and the middle lane often varies between vehicles that drive at 80 to 120 km/h. Thus separating the speed on each lane and limiting the variation. This means that the vehicles are less likely to react to each other. Or in other words, the vehicles do not have to anticipate as quickly, often or radically. The vehicles on the road ahead are driving at approximately the same speed.
With QRM implementations we create the same separation through the FTMS, for each type of product or order. The categorization of variability can be applied in various ways. For example, on the basis of complexity of orders, processing time, industry and processing steps. This is different for every company, so customized work. QRM is therefore much more than just reducing the occupancy to 80%. It’s searching for the optimum flow in the variability that the world around us demands.