
MCT Mapping Tool
By Denis Laverdet – Quick Response Enterprise, France
QRM toolbox: MCT mapping
The first key concept of QRM is ‘realizing the importance of time’. It helps the company and its managers become aware of its true value and understand how long delays affect total cost of ownership, quality and service. One of the tools for collective awareness is MCT mapping.
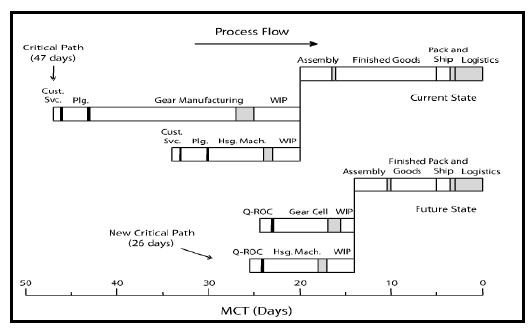
During the realization of this cartography, the team follows the progress of an order from order entry by the customer until the delivery of this order, over the critical path. This analysis is formalized through a diagram that represents the proportional time. It distinguishes, at each step, the amount of added value from a person or a resource on the job (grey areas) and the time of non-added value (white areas). These are the activities not seen by the customer. The white areas represent 90% of the total time and reflects on the way the company is organized.
The results obtained in just a few hours, allows them to be immediately shared with the teams and shows where the priorities lie in order to start lead time reduction.
An example of MCT mapping created at a machining company based in the west of France:
During this session the team realized that a customer delivery time of approximately ten weeks was supported by a MCT of 176 calendar days (approx. 25 weeks!). The white areas linked to the organization’s production were clearly drawn. On the other hand, the sequence of operations upstream of production have not been identified as a priority for starting a QRM project. Finally, despite a number of long technical operations, the calculated ratio showed that only 7.4% of the total MCT were value-adding activities!